|
Getting your Trinity Audio player ready... |
Tabla de Contenido/ Table of Contents
- 1 What Are Our Miami-Dade County Commissioners Wasting Time On? The Crisis of District 3 and Its Priority: Renaming Streets
- 2 What Is Miami-Dade County’s District 3 and What Communities Does It Include?
- 2.1 Miami – Neighborhoods and Unincorporated Communities
- 2.2 El Portal
- 2.3 Miami Shores
- 2.4 Summary Table: Communities of Miami-Dade County’s District 3
- 2.5 Clarifications and Sources
- 3 The Most Critical Issues in District 3
- 4 Housing and Urban Development
- 5 Meanwhile… What Is Commissioner Keon Hardemon Doing?
- 6 Commissioners’ Debate Analysis
- 7 The Irony of These Names
- 8 Leadership or Distraction?
What Are Our Miami-Dade County Commissioners Wasting Time On? The Crisis of District 3 and Its Priority: Renaming Streets
Miami-Dade County’s District 3 faces critical structural issues that demand immediate attention. From the housing crisis to the collapse of basic infrastructure, residents live in a paradox: while their leaders promote street name changes, urgent needs continue to pile up without solutions.
What Is Miami-Dade County’s District 3 and What Communities Does It Include?
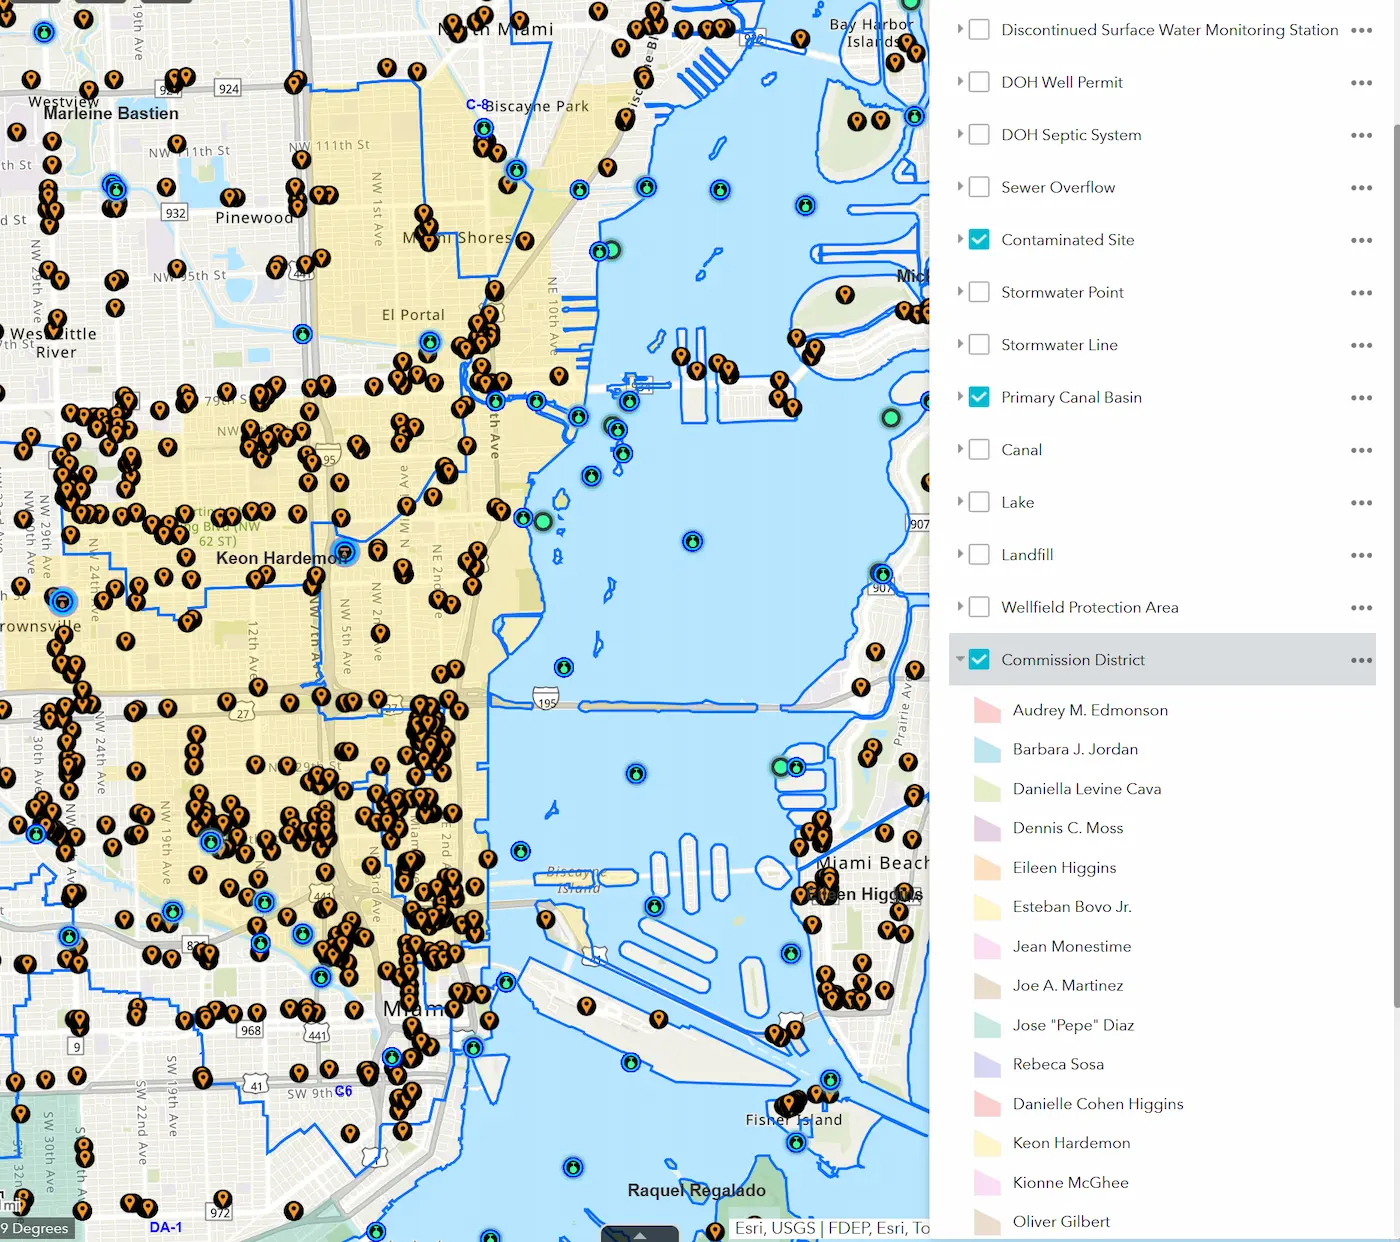
District 3 is one of the most diverse and culturally rich areas in the county, with historic communities that have faced decades of disinvestment, high crime rates, and a housing crisis.
📍 Cities and Communities That Make Up Miami-Dade County’s District 3: (Include dates of origin and population)
District 3 consists of the incorporated municipalities of Miami, El Portal, and Miami Shores. Within Miami, most of the mentioned areas are neighborhoods or unincorporated communities, meaning their boundaries and demographic data are generally included in the city’s census.
📍 Cities and Communities That Make Up Miami-Dade County’s District 3 (Based on historical records and the U.S. Census 2020/2023 estimates):
Miami – Neighborhoods and Unincorporated Communities
Liberty City
- Founded: Developed in the 1930s as a public housing project for African Americans during segregation.
- Population: ~25,000 (2023).
- Note: Historic epicenter of civil rights movements; 98% of its residents are African American.
Little Haiti (Historically known as Lemon City, Little River, and Edison)
- Founded: Established in the 1980s due to massive Haitian migration following the Duvalier regime.
- Population: ~34,000 (2023).
- Note: 68% of the population is of Haitian origin; the census does not account for thousands of undocumented residents.
Upper East Side (Also called East Side, commonly known as Northeast Miami)
- Founded: Residential development began in the 1920s as part of Miami’s northward expansion.
- Population: ~45,000 (2023).
- Note: Includes areas such as Magnolia Park, Bay Point, Morningside, Bayside, Belle Meade, Shorecrest, and Palm Grove.
Allapattah
- Founded: Incorporated in 1924 as an independent town, annexed by Miami in 1925.
- Population: ~60,000 (2023).
- Note: 85% of its residents are Hispanic, primarily Cuban and Central American.
Wynwood
- Founded: Industrial zone created in the 1910s; transformed into an arts district since 2009.
- Population: ~13,000 (2023).
- Note: Only 15% of its original residents remain due to gentrification.
Parts of Downtown Miami Within District 3
Overtown
- Founded: Established in 1896 as “Colored Town” during Henry Flagler’s railroad expansion.
- Population: ~10,000 (2023).
- Note: Once a prosperous African American cultural center, later fragmented by highway construction in the 1960s.
Buena Vista
- Founded: Developed in the 1920s as a middle-class worker suburb.
- Population: ~12,000 (2023).
- Note: Home to the Miami Design District, which has displaced many historical residents.
Edgewater
- Founded: Emerged in the 1910s as a coastal residential area.
- Population: ~18,000 (2023).
- Note: Rapid gentrification since 2010; the average home price exceeds $600,000.
El Portal
- Incorporated: 1937.
- Population: ~2,300 (2023 estimate).
- Characteristics:
- One of the smallest municipalities in Florida, covering only 0.5 km².
- 65% of the population is African American; median household income: $45,000.
- Challenges: Aging infrastructure and lack of commercial investment.
Miami Shores
- Incorporated: 1932.
- Population: ~11,500 (2023 estimate).
- Characteristics:
- Middle to upper-middle-class residential area, known for its historic architecture.
- 70% of residents are non-Hispanic white; median household income: $110,000.
- Controversy: Increasing pressure for urban densification projects, threatening its suburban character.
Summary Table: Communities of Miami-Dade County’s District 3
| Community | Neighborhoods | Type | Founded/Incorporated | Population (2023) | Key Notes |
|---|---|---|---|---|---|
| Miami | Liberty City, Little Haiti, Upper East Side, Allapattah, Wynwood, Buena Vista, and Edgewater | Incorporated Municipality | July 28, 1896 | City of Miami (Incorporated): – Has its own government. – Independent municipal services. Miami-Dade County: – Governs unincorporated areas. | |
| Liberty City | Unincorporated Neighborhood | 1930s | ~25,000 | Segregated housing project; 98% African American. Historic center of civil rights movements. | |
| Little Haiti | Unincorporated Neighborhood | 1980s | ~34,000 | Previously called Lemon City. 68% Haitian; large undocumented population not counted in census. | |
| Upper East Side | Unincorporated Neighborhood | 1920s | ~45,000 | Includes Morningside, Belle Meade, and Shorecrest. 40% Hispanic households. | |
| Allapattah | Unincorporated Neighborhood | 1924 (absorbed by Miami) | ~60,000 | 85% Hispanic (mostly Cuban and Central American). Low-income area. | |
| Wynwood | Unincorporated Neighborhood | 1910s* | ~13,000 | Transformed into an arts district (2009). Only 15% of original residents remain. | |
| Overtown | Unincorporated Neighborhood | 1896 | ~10,000 | Formerly “Colored Town”. Fragmented by highway construction in the 1960s; currently undergoing revitalization. | |
| Buena Vista | Unincorporated Neighborhood | 1920s | ~12,000 | Home to the Miami Design District. Gentrification displacing historic residents. | |
| Edgewater | Unincorporated Neighborhood | 1910s | ~18,000 | High-rise luxury apartments. Average home price: $600,000+. | |
| El Portal | – | Incorporated Municipality | 1937 | ~2,300 | 65% African American. Aging infrastructure; covers only 0.5 km². |
| Miami Shores | – | Incorporated Municipality | 1932 | ~11,500 | 70% non-Hispanic white. Pressure for urban densification; median household income: $110,000. |
Clarifications and Sources
Gentrification: In Wynwood, Edgewater, and Buena Vista, urban transformation has displaced low-income residents.
Neighborhoods vs. Municipalities: Only Miami, El Portal, and Miami Shores have autonomous governments. The rest are unincorporated areas under county jurisdiction.
Population Estimates: Based on 2020 Census and American Community Survey (ACS) 2023 projections.
Boundary Conflicts: Parts of Allapattah and Miami Shores face annexation disputes proposed by the City of Miami.
Sources: U.S. Census | Florida Demographic Data Center | Miami-Dade County Historical Archives
This table highlights the diversity and contrasts of District 3, where structural solutions—not street name changes—are urgently needed. 🚧🏙️ While District 3 invests in renaming streets, its historical communities face demographic and economic challenges that require more attention than symbolic changes.
The Most Critical Issues in District 3
Affordable Housing Crisis 🏠
Lack of affordable housing is displacing many families.
Rising evictions and ineffective rent assistance programs.
Housing Emergency 🏘
1 in 3 families spends more than 50% of their income on rent.
4,200 affordable housing units are urgently needed, but funding is insufficient.
Deteriorating Infrastructure 🚧
Schools have outdated electrical systems and bridges are classified as “deficient”. Poorly maintained roads, lack of streetlights, and deficient drainage.
Transportation Infrastructure
- Major Roads:
- NW 7th Avenue & NW 27th Avenue – Critical arteries with heavy traffic, recurring potholes, and lack of maintenance.
- Biscayne Boulevard (Edgewater) – A modern corridor with bike lanes but severely congested due to luxury condo development.
- Public Transportation:
- Metrobus: Routes like 2 (Little Haiti) and 12 (Allapattah) connect the district, but service frequency is limited.
- Metrorail: Santa Clara Station (Allapattah) is the only station in the district; plans to extend the North Corridor line are stalled due to lack of funds.
- Critical Problems:
- 40% of secondary streets have deep cracks (2023 audit).
- Lack of illuminated sidewalks in Liberty City and Little Haiti, increasing accident risks.
Water and Sanitation Infrastructure
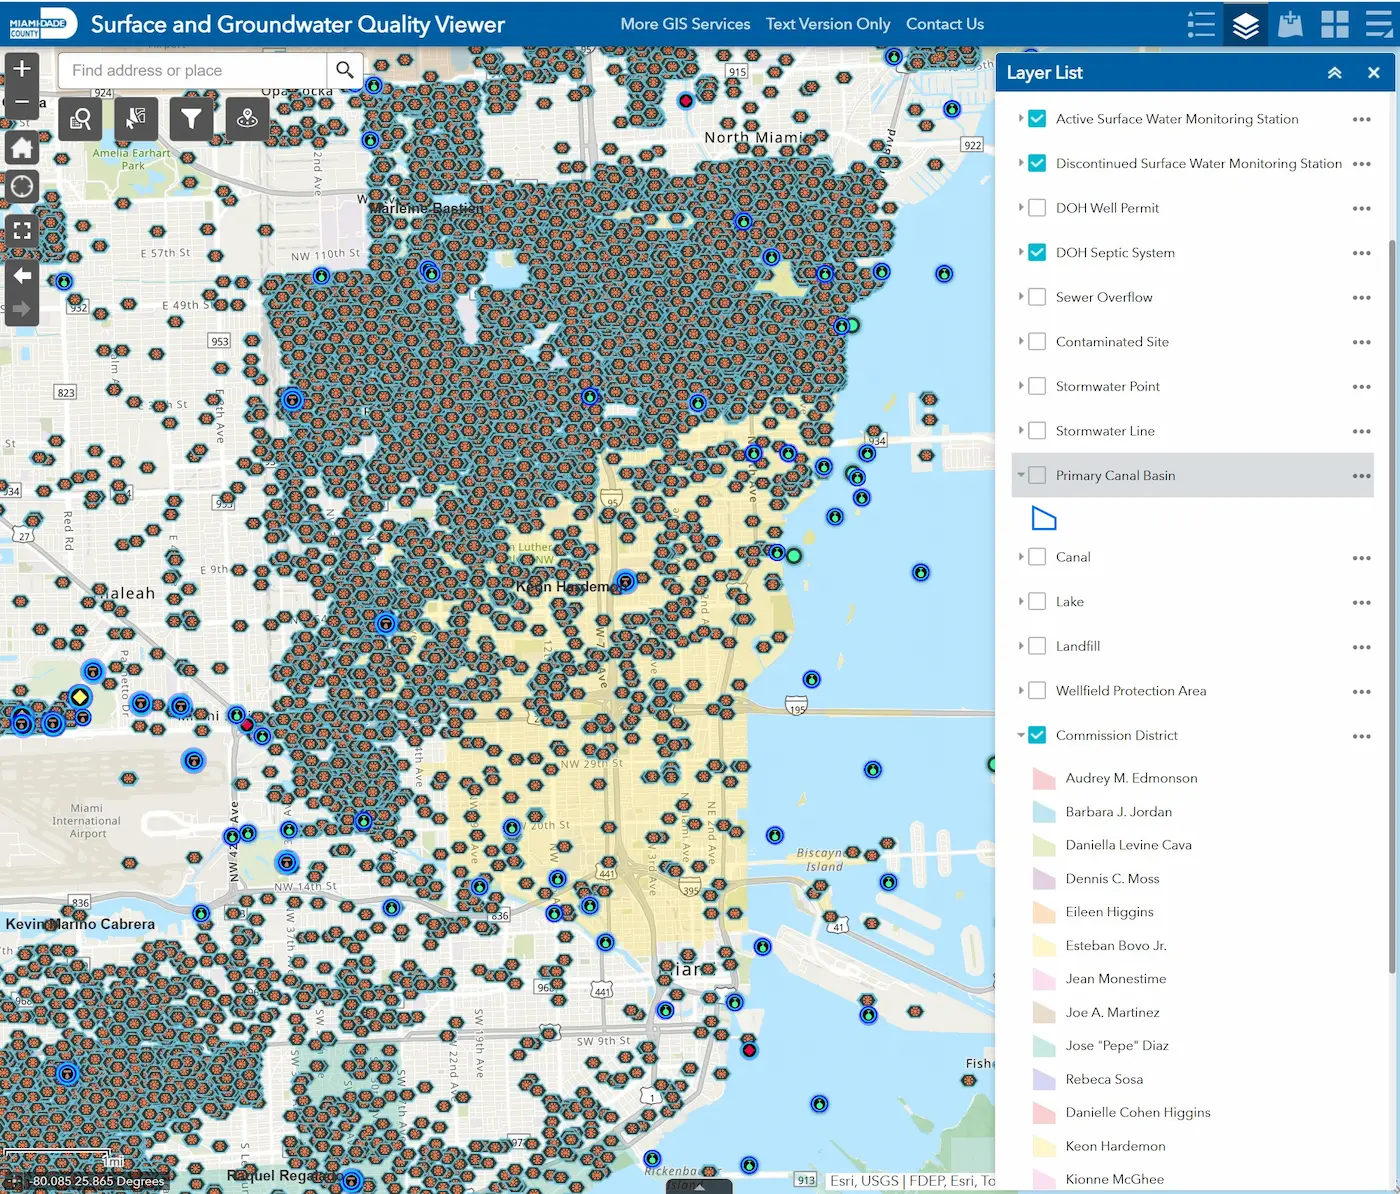
- Obsolete Septic Tanks:
- 12,000 homes in Liberty City and Little Haiti rely on failing septic systems, contaminating aquifers.
- $150 million needed to replace them with sewer systems, but only $5 million has been allocated (2024 budget).
- Recurring Flooding:
- Low-lying areas like Overtown flood with moderate rainfall due to blocked drains.
Educational and Health Infrastructure
- Public Schools:
- Miami Northwestern Senior High (Liberty City) – Buildings with leaks and outdated electrical systems.
- Schools in Allapattah – Overcrowded, with classroom ratios of 30 students per teacher.
- Health Care:
- Only ONE public health center in Little Haiti serves 34,000 residents.
- Nearby hospitals (Jackson Memorial) are overwhelmed.
Housing and Urban Development
- Affordability Crisis:
- 1 in 3 families spends more than 50% of their income on rent.
- Projects like Liberty Square (renovated in 2023) only offer 700 units, far below demand.
- Gentrification:
- In Wynwood and Edgewater, luxury towers ($800,000+ per apartment) are displacing historical residents.
Community Infrastructure
- Parks and Recreation:
- Charles Hadley Park (Liberty City) – Largest park, but with broken equipment and lack of maintenance.
- Gibson Park (Overtown) – Small, with deteriorating green areas.
- Community Centers:
- Little Haiti Cultural Complex – Provides programs but has limited capacity.
Economic Infrastructure
- Commercial Corridors:
- NW 54th Street (Little Haiti) – Small Haitian-owned businesses struggle due to lack of investment.
- Miami Design District (Buena Vista) – Luxury shopping hub that contrasts with surrounding poverty.
- Industrial Zones:
- Allapattah houses warehouses and workshops, but lacks strict environmental regulations.
Environmental Infrastructure
- Pollution:
- Contaminated with industrial chemicals and wastewater.
- Air quality is poor in areas near I-95 highways.
- Climate Resilience:
- Stormwater Master Plan projects are delayed due to lack of funds.
Rising Crime and Violence 🔫
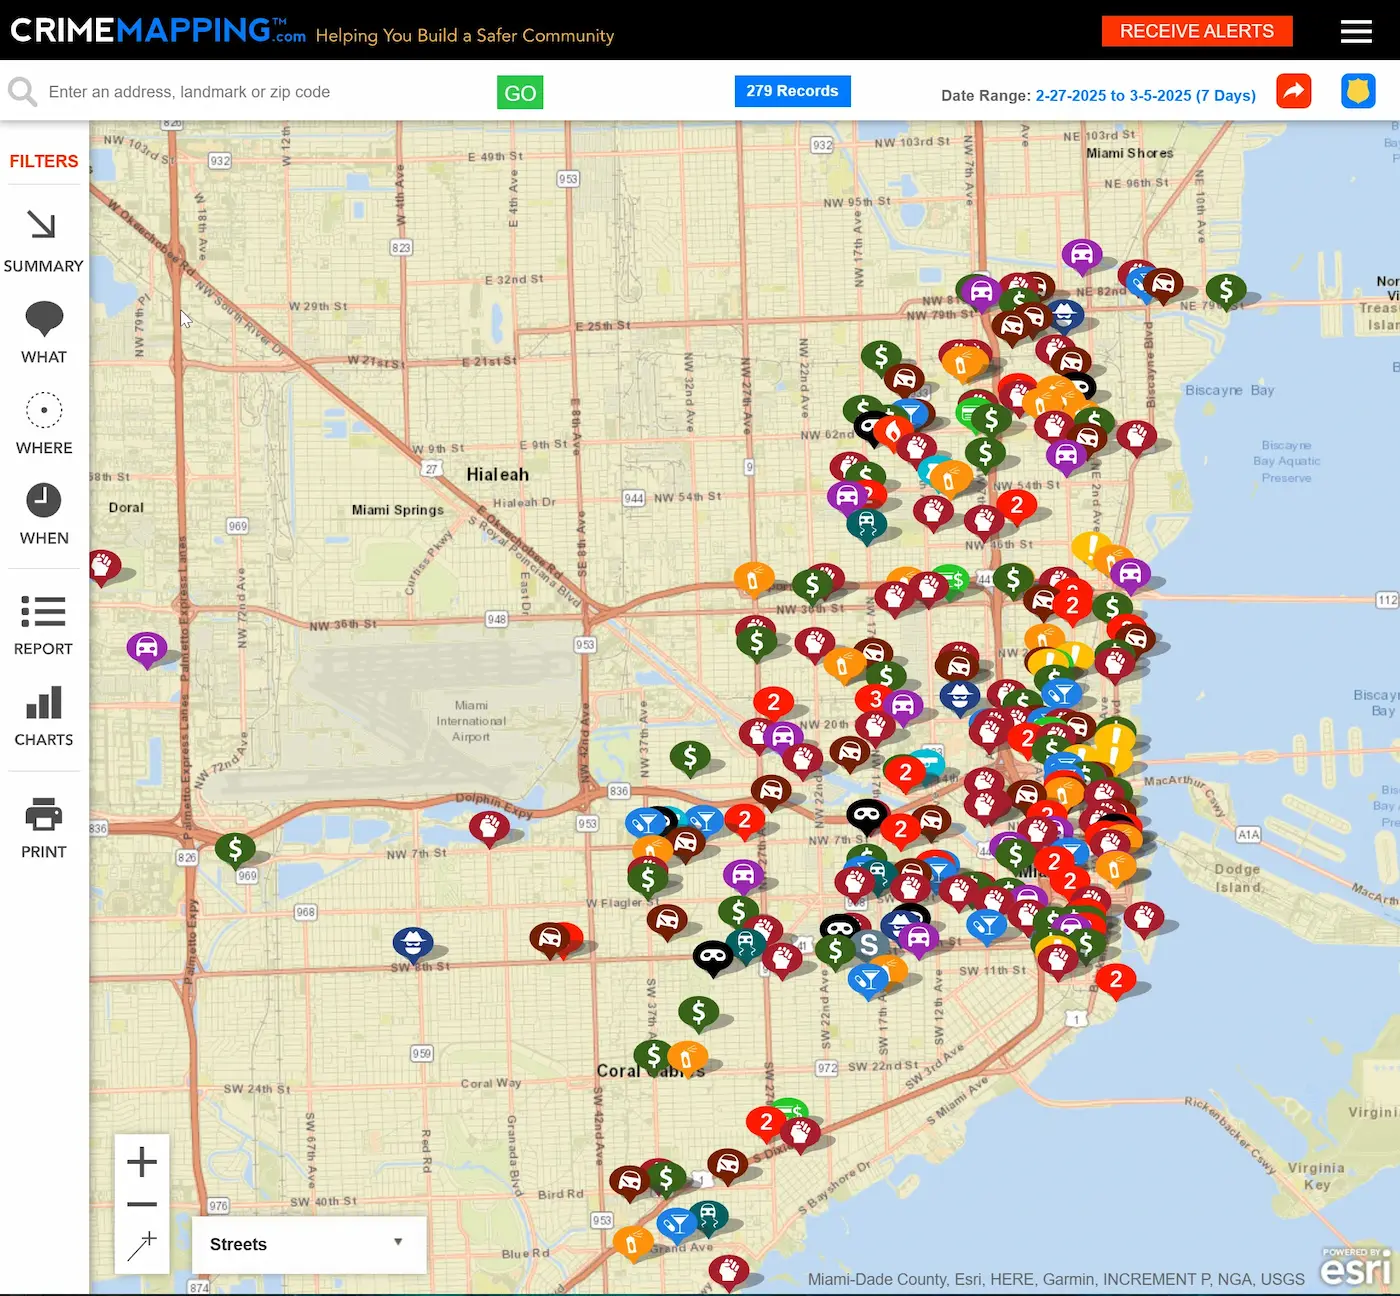
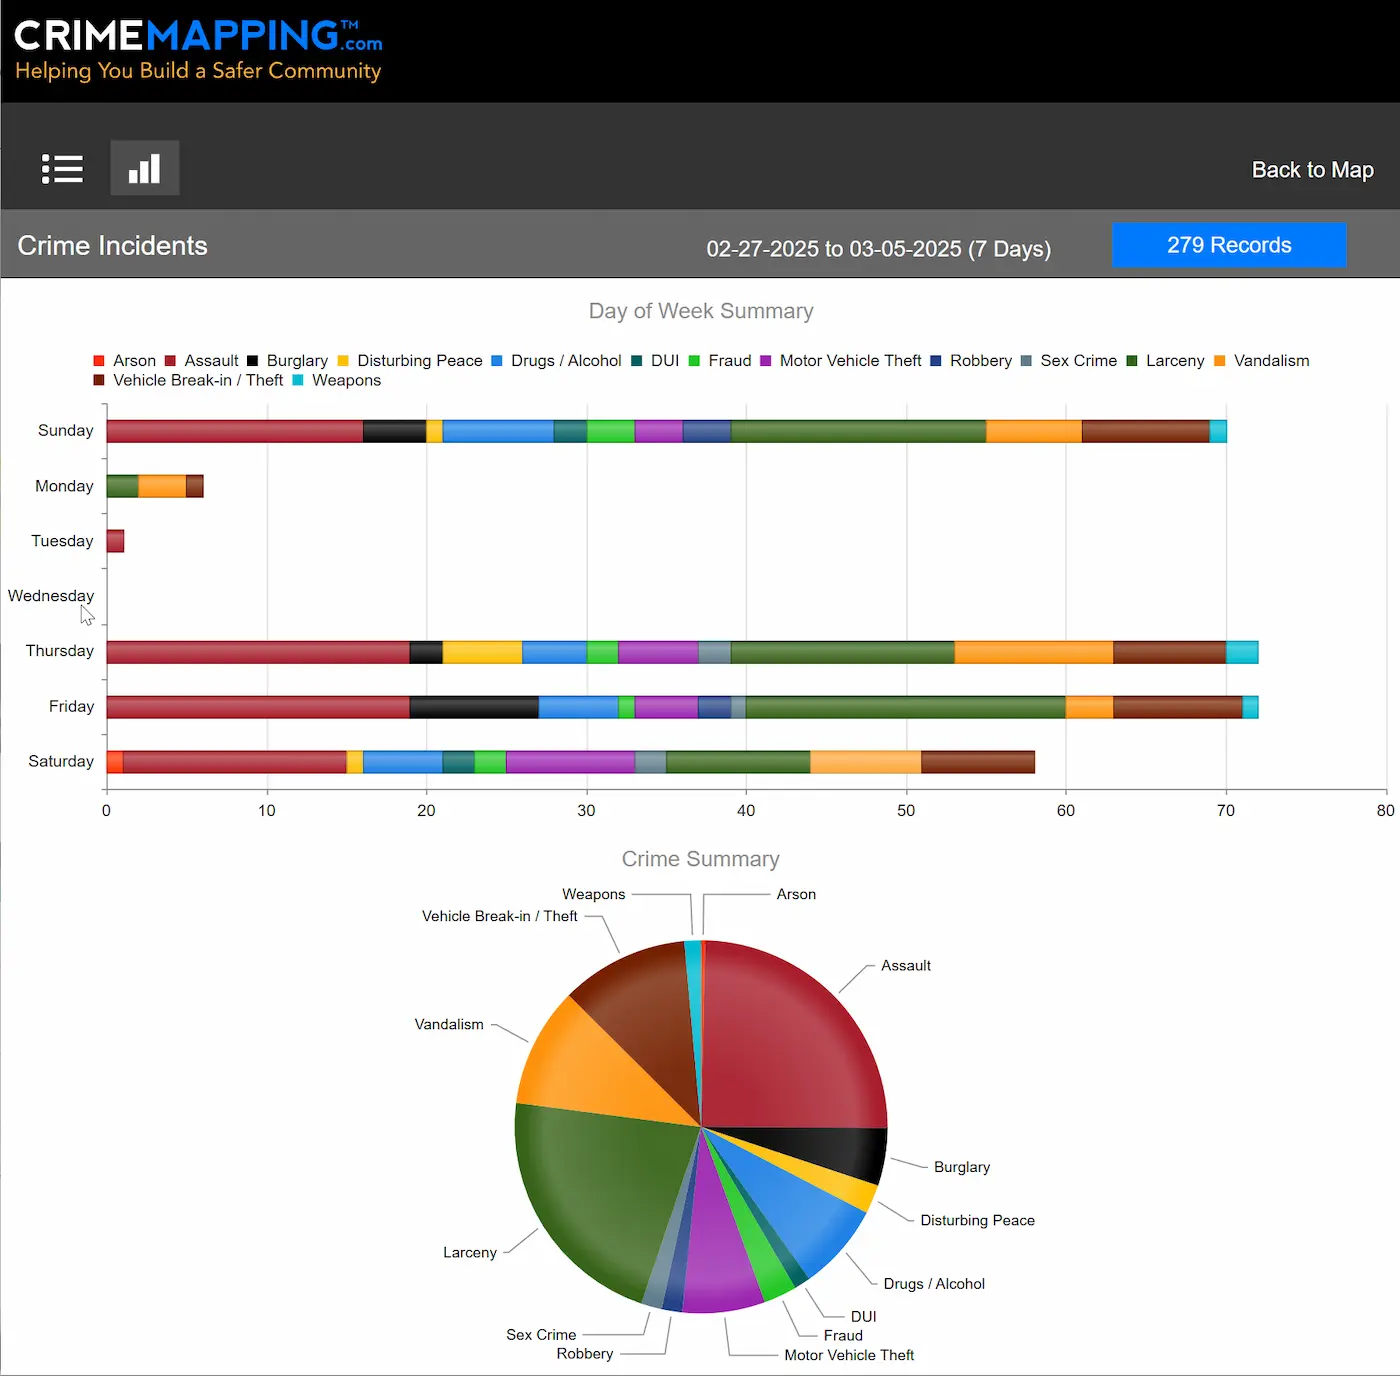
Areas like Liberty City and Overtown have some of the highest crime rates in the county.
Lack of investment in community crime prevention programs.
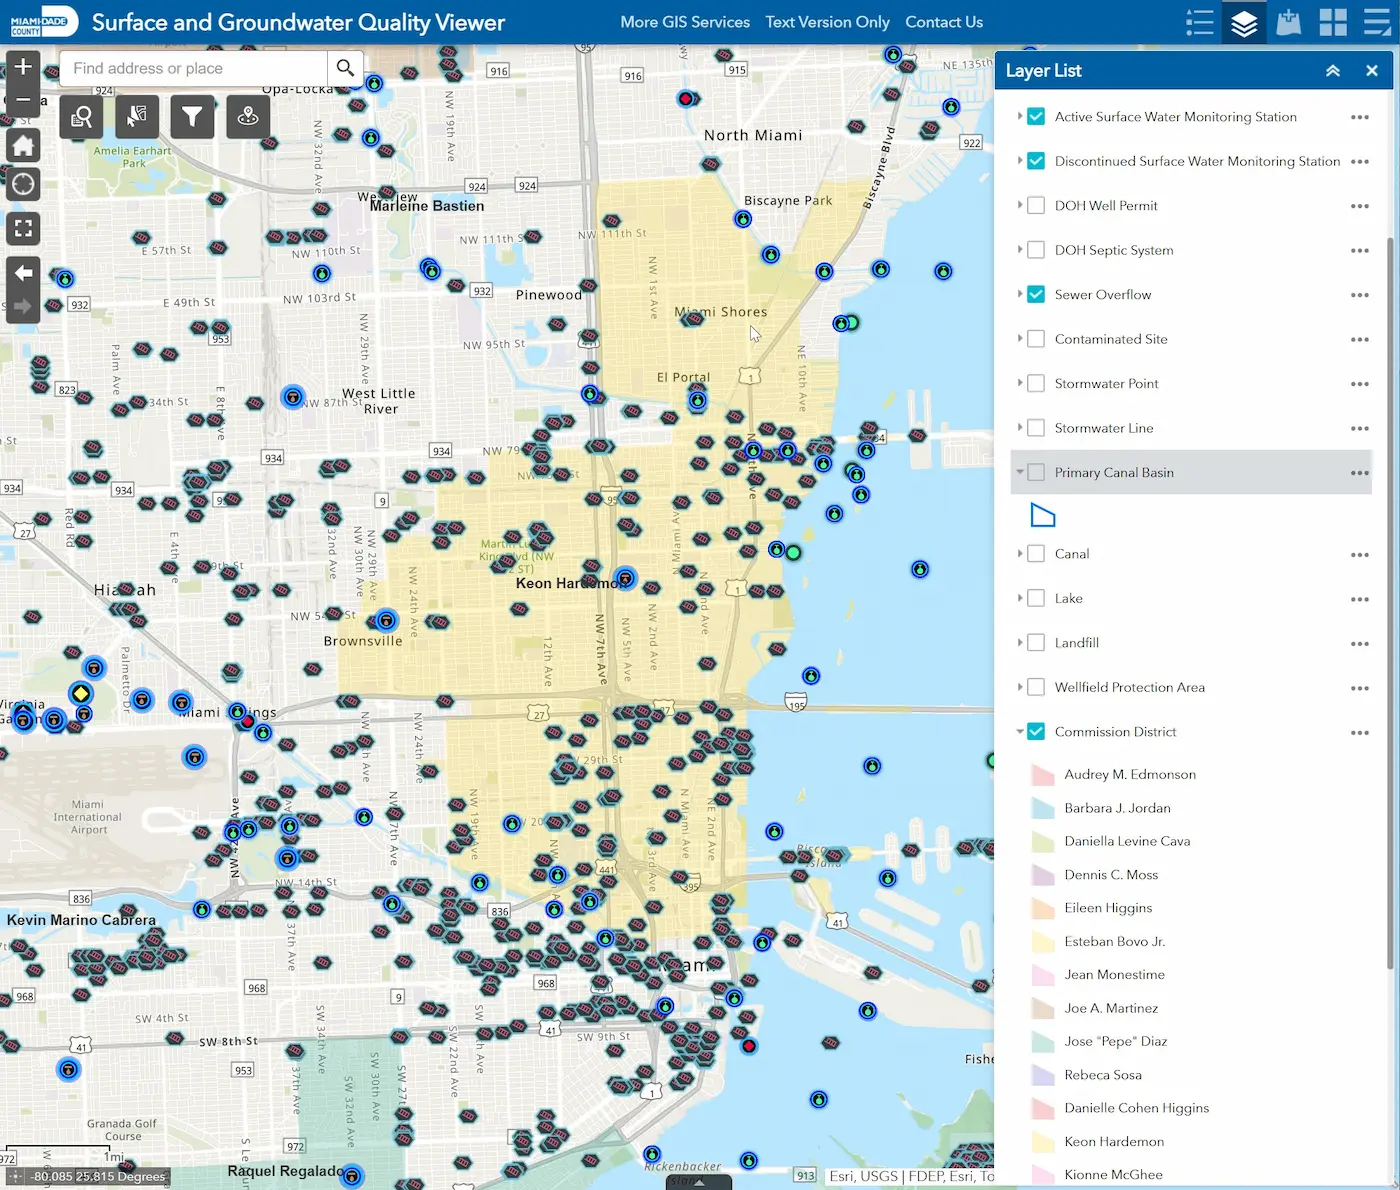
Septic Tank Crisis 💧
12,000 homes rely on failing septic systems.
45% of these systems have recurring failures, contaminating groundwater.
$150 million is needed for sewer system replacement, but only $5 million has been allocated for 2025.
Meanwhile… What Is Commissioner Keon Hardemon Doing?
Instead of addressing these urgent issues, Hardemon has focused her time and effort on renaming streets in District 3. In recent Miami-Dade County Commission meetings, she promoted two resolutions to co-designate streets with trivial names.
🔹 First Resolution: Renaming streets in honor of local figures:
“Rudman Way”
“Mirta Sandra Fuentes Way”
“Nat Moore Way”
“Luther Campbell Way”
🔹 Second Resolution: Renaming streets after songs and pop culture phrases, such as:
“What’s My Name Street”
“Act Up Street”
“We The Best Terrace”
“Trick Love The Kids Street”
“No Pain, No Gain Street”
Total Cost of the Street Name Changes: $560,000, which could instead be used to:
Repair 112 septic tanks.
Patch 1,200 critical potholes.
Fund full scholarships for 50 students in technical programs.
Despite the controversy, Hardemon successfully suspended Rules 9.02(a) and 9.02(g), eliminating public hearings and impact assessments. This prevented residents from voicing their opinions on spending and district priorities.
Commissioners’ Debate Analysis
Keon Hardemon’s Arguments in Favor:
Community Revitalization – Claims the measure will attract tourism and transform the area.
Lack of Investment – Says the community has been ignored and this change could generate interest.
Tourist Attraction – Believes catchy street names can attract visitors and create an identity.
📌 Hardemon’s Statement:
“We want people to have a reason to visit this community and witness its transformation.”
Objections from Other Commissioners:
Lack of Community Consultation – Residents and businesses were not consulted.
Impact on Property & Businesses – Names like “Poor Little Rich Girl Street” could harm the community’s image.
Dangerous Precedent – Allowing this could open the door to more trivial name changes in the future.
📌 Commissioner’s Objection:
“How do we explain to someone how to get home when they have to say, ‘Turn right on Poor Little Rich Girl Street and left on Big Money Baller Street’?”
To mitigate the impact, a “special zone” was proposed to prevent future name changes from disrupting county-wide naming rules. However, the controversy over misplaced priorities remains.
The Irony of These Names
New street names like “Peace In Da Hood Street” contrast sharply with reality:
Shootings increased 22% in 2024 in District 3.
Only 2 additional patrol units were assigned this year, despite residents’ demands.
The message is clear: Residents don’t need streets named after songs, they need clean water, drivable roads, and safe housing.
Leadership or Distraction?
Renaming streets could be a complementary action in times of stability, but not a priority amid urgent crises.
“If streets could talk, they would scream ‘Help!’ instead of repeating rap lyrics.”
Meanwhile, real problems remain unresolved.
Want more post like this?
Head over to our homepage for the latest updates from South Florida and beyond:
